Stickiness
Last updated on
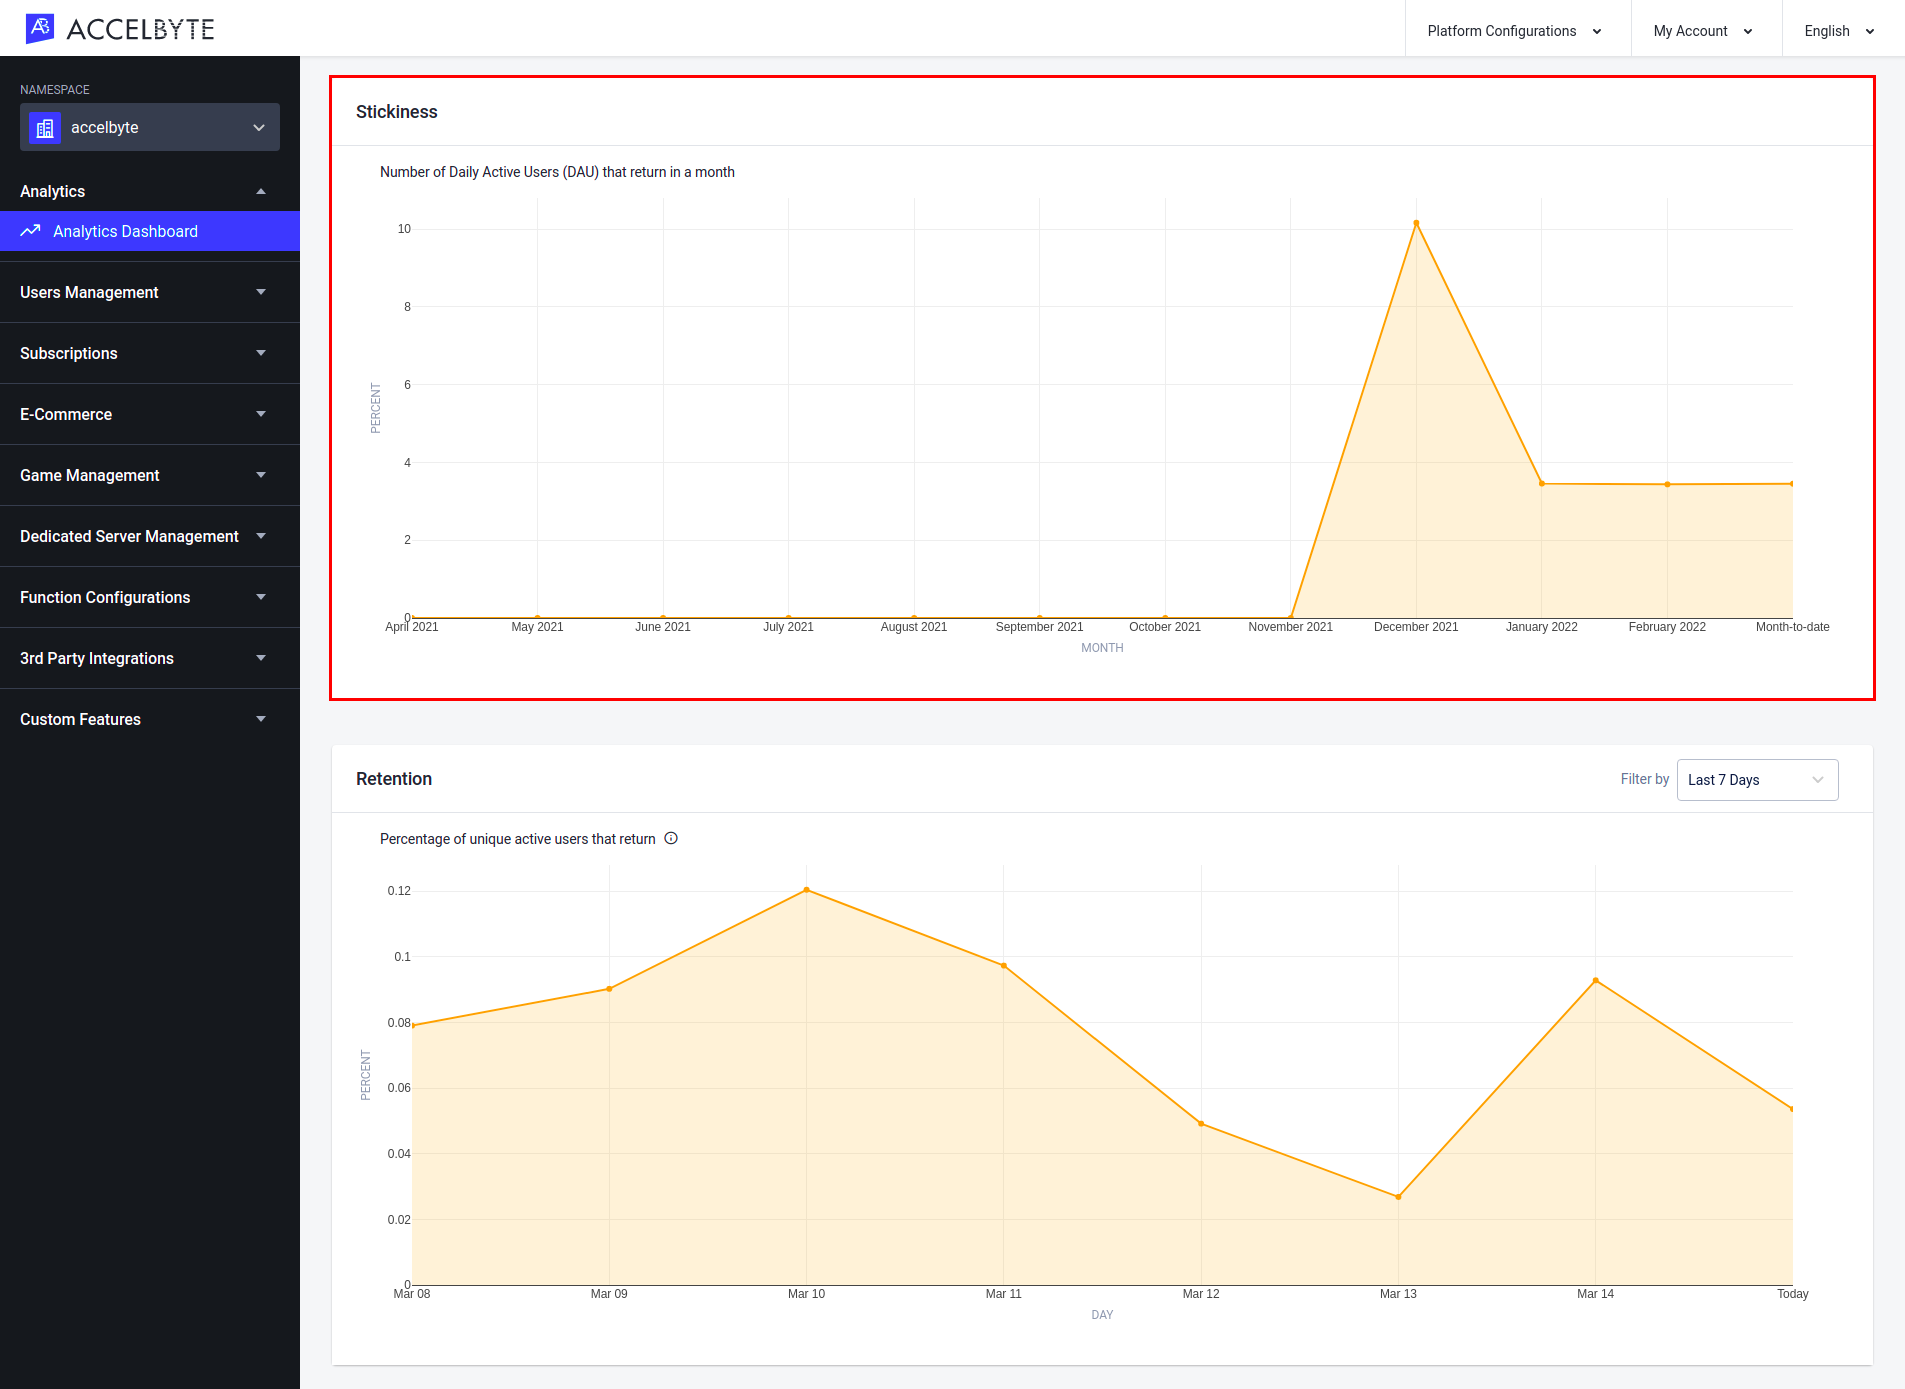
Stickiness
The Stickiness line graph in the Retention tab shows the average number of DAU from the past 30 days divided by the number of MAU. This data is shown in a 30-day time series covering the current year. For example, if today is October 30th, the most recent data point will include data from October 1st - 30th, the previous data point will include data from September 1st - 30th, and so on.
This metric shows you how many days the average player plays your game in a month. For example, a stickiness value of 50% means that the average player played your game for 15 out of 30 days.